| Epicenter Near | Magnitude | Depth (km) | Local Time |
|---|---|---|---|
| TYNDRUM,STIRLING | 0.6 | 8 | 09:49:57 BST Wed, 08-Jul-26 |
| SILVERDALE,LANCASHIRE | 0.5 | 2 | 06:45:13 BST Wed, 08-Jul-26 |
| MULL,ARGYLL & BUTE | 1.0 | 8 | 02:53:21 BST Sun, 05-Jul-26 |
| GLEN CARNACH,HIGHLAND | 1.1 | 9 | 16:41:02 BST Sat, 04-Jul-26 |
| SHEILDAIG,HIGHLAND | 1.0 | 2 | 15:39:49 BST Fri, 03-Jul-26 |
| COLD WESTON,SALOP | 1.6 | 7 | 01:52:11 BST Wed, 01-Jul-26 |
| NORTHERN NORTH SEA | 3.1 | 10 | 20:23:57 BST Tue, 30-Jun-26 |
| HOLYWELL,CORNWALL | 0.5 | 2 | 05:14:10 BST Tue, 30-Jun-26 |
| ELSFIELD,OXFORDSHIRE | 1.6 | 5 | 13:45:06 BST Mon, 29-Jun-26 |
| FARLOW,SHROPSHIRE | 0.8 | 8 | 10:09:05 BST Sat, 27-Jun-26 |
| LLANBEDR,POWYS | 1.5 | 9 | 17:43:49 BST Wed, 24-Jun-26 |
| MORENISH,PERTH/KINROSS | 0.5 | 8 | 16:20:12 BST Wed, 24-Jun-26 |
| NORTH MUSKHAM,NOTTS | 0.9 | 8 | 01:07:25 BST Wed, 24-Jun-26 |
| PUBIL,PERTH & KINROSS | 0.5 | 5 | 01:22:25 BST Tue, 23-Jun-26 |
| SILVERDALE,LANCASHIRE | 0.7 | 3 | 01:38:42 BST Mon, 22-Jun-26 |
| KINLOCH HOURN,HIGHLAND | 0.7 | 6 | 06:08:58 BST Sun, 21-Jun-26 |
| PUBIL,PERTH & KINROSS | 1.6 | 5 | 14:34:19 BST Sat, 20-Jun-26 |
| CROESOR,GWYNEDD | 0.6 | 3 | 22:16:22 BST Wed, 17-Jun-26 |
| KILCHOAN,ARGYLL & BUTE | 0.8 | 5 | 10:36:52 BST Wed, 17-Jun-26 |
| SILVERDALE,LANCASHIRE | 0.5 | 3 | 22:11:23 BST Mon, 15-Jun-26 |
| PUBIL,PERTH & KINROSS | 0.9 | 5 | 05:17:57 BST Thu, 11-Jun-26 |
| MINTON,SHROPSHIRE | 0.4 | 9 | 00:54:47 BST Thu, 11-Jun-26 |
| TANWORTH,WARWICKSHIRE | 1.5 | 7 | 06:43:42 BST Wed, 10-Jun-26 |
| SILVERDALE,LANCASHIRE | 0.7 | 3 | 20:31:46 BST Sun, 07-Jun-26 |
| SILVERDALE,LANCASHIRE | 1.1 | 3 | 18:13:05 BST Sun, 07-Jun-26 |
| SILVERDALE,LANCASHIRE | 2.2 | 3 | 22:35:31 BST Sat, 06-Jun-26 |
| GARRIGILL,CUMBRIA | 1.2 | 3 | 09:29:11 BST Fri, 05-Jun-26 |
| LOCHBROOM,HIGHLAND | 1.0 | 14 | 06:14:49 BST Fri, 05-Jun-26 |
| ATHERTON,GTR MANCHESTER | 1.4 | 9 | 22:55:32 BST Sun, 31-May-26 |
| INVERIE,HIGHLAND | 0.4 | 8 | 00:38:23 BST Sun, 31-May-26 |
| PUBIL,PERTH & KINROSS | 0.8 | 5 | 20:04:08 BST Fri, 29-May-26 |
| PUBIL,PERTH & KINROSS | 0.5 | 7 | 09:04:59 BST Fri, 29-May-26 |
| SOUTHERN NORTH SEA | 2.3 | 30 | 22:11:02 BST Tue, 26-May-26 |
| BADACHRO,HIGHLAND | 0.8 | 8 | 04:39:58 BST Tue, 26-May-26 |
| ENGLISH CHANNEL | 2.2 | 8 | 21:10:45 BST Sun, 24-May-26 |
| LOCHALINE,HIGHLAND | 0.9 | 10 | 00:27:52 BST Fri, 22-May-26 |
| BRAMHAM,WEST YORKSHIRE | 1.2 | 27 | 23:44:11 BST Thu, 21-May-26 |
| BARRISDALE,HIGHLAND | 2.6 | 8 | 13:23:58 BST Wed, 20-May-26 |
| DALAVICH,ARGYLL & BUTE | 0.9 | 4 | 11:23:16 BST Tue, 19-May-26 |
| CELTIC SEA | 0.8 | 3 | 13:08:58 BST Sun, 17-May-26 |
| PUBIL,PERTH & KINROSS | 0.1 | 3 | 05:38:54 BST Sun, 17-May-26 |
| LERAGS,ARGYLL & BUTE | 0.5 | 3 | 00:55:38 BST Sun, 17-May-26 |
| SILVERDALE,LANCASHIRE | 2.3 | 3 | 10:11:19 BST Wed, 13-May-26 |
| WISTON,DYFED | 1.4 | 8 | 19:22:19 BST Tue, 12-May-26 |
| BROTTON,NORTH YORKSHIRE | 1.7 | 11 | 14:13:58 BST Tue, 12-May-26 |
| LLANBISTER,POWYS | 2.7 | 5 | 08:33:27 BST Tue, 12-May-26 |
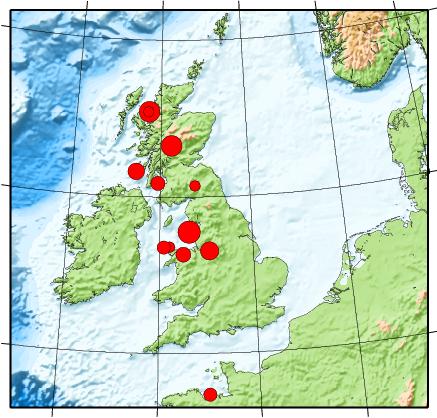
46 UK Earthquakes in the last 50 days.
Reproduced with the permission of the British Geological Survey © NERC. All rights Reserved.